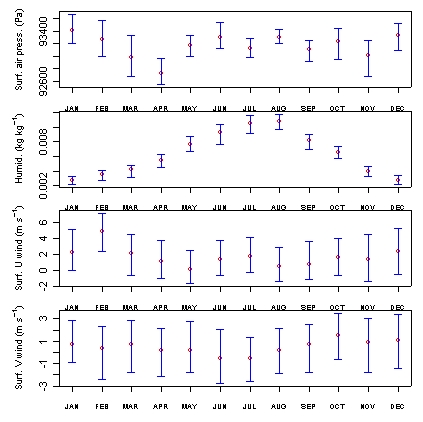
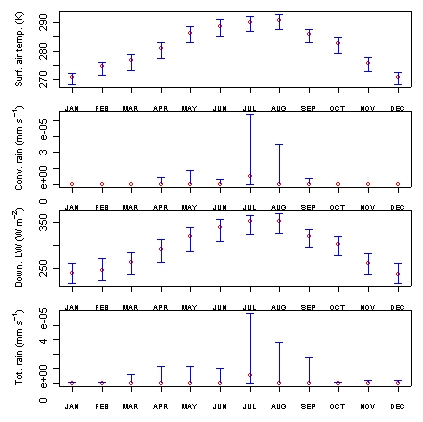
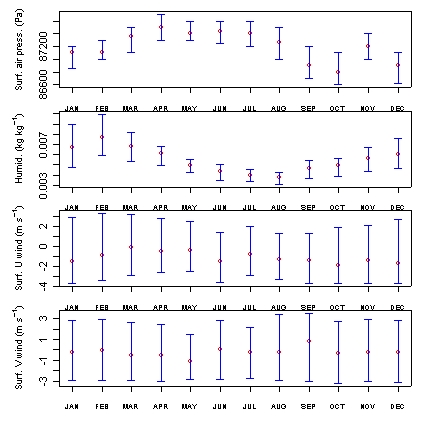
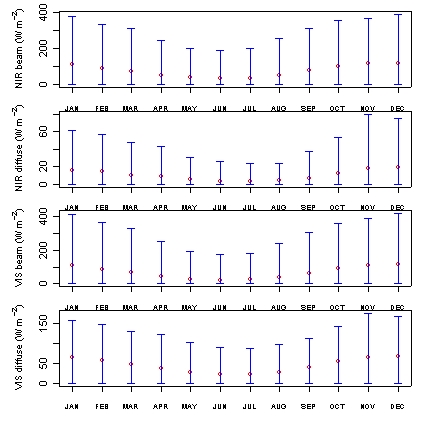
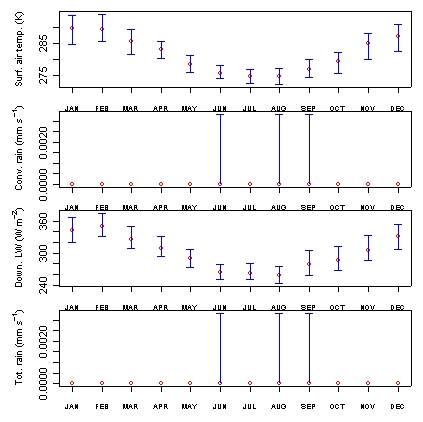
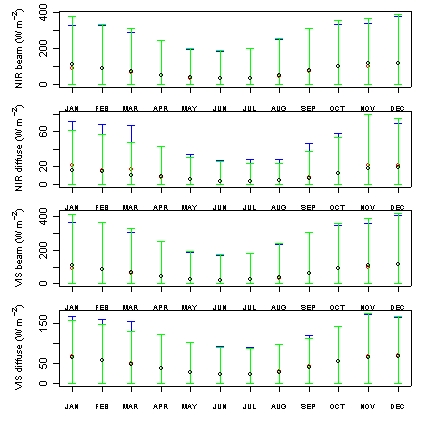
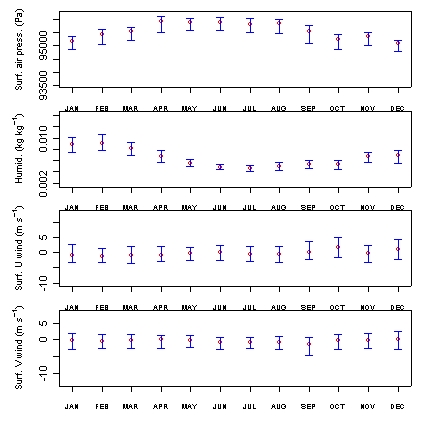
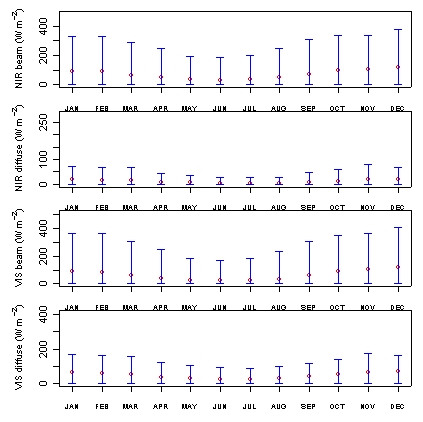
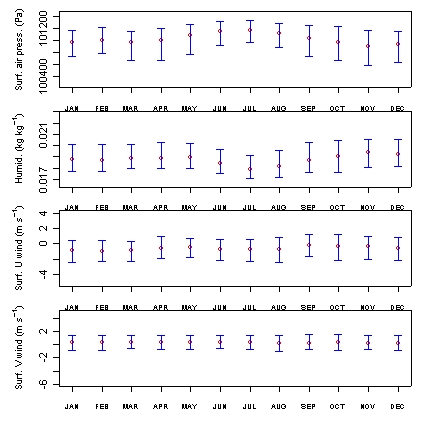
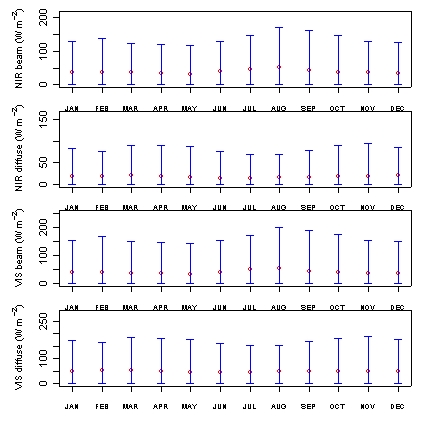
Plots of Forcing data
Plots show the 5 year median values (by month) of the
minimum, median and maximum daily values for
each forcing variable (note: precipitation has
not been integrated). Plots were constructed using
5 yrs of NCEP reanalysis data (1998-2002), interpolated
at 15 min. intervals (a 'dummy' forcing dataset).
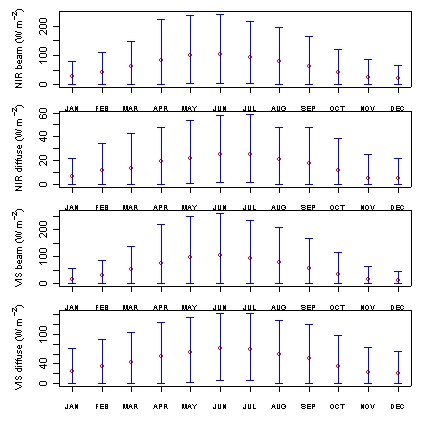
1.1 Tumbarumba - CSIRO
All these variables are from the CSIRO (2001-2004) dataset,
except for the five solar rad. variables which are from NCEP (2001-2004).
A combined diagram should appear below.
1.2 Tumbarumba - combined
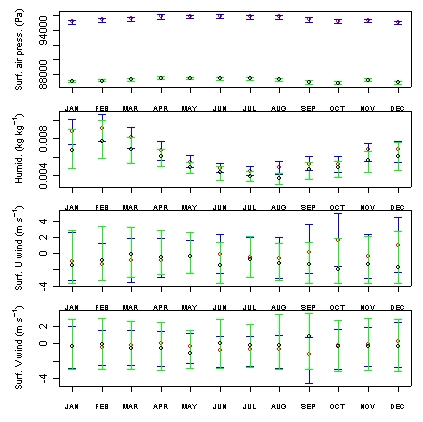
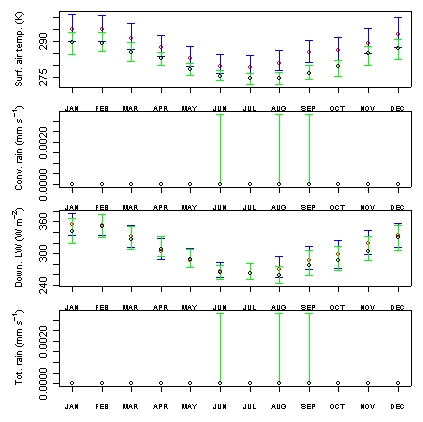
1.3 Tumbarumba - NCEP (1998-2002)

2. Manaus - NCEP (1998-2002)

3. Vienna (or Saclay) - NCEP (1998-2002)